
Discover more from Harmony
How to handle conflicts between metrics using workarounds while Ranking Protein Sources - P2
How to handle conflicting metrics using empirical workarounds and slice data in different axes to reach a single ranked list. Part 2 of ranking proteins.
In the previous article, we identified a derived metric Lean Protein Index to rank food items with protein and now we will continue to look at completeness of protein sources, processed vs natural food sources, and quality vs expense for food items. We will conclude with two lists. One is an aggregated list of all food items ranked in order of preference as a protein source. Second a similar list but broken by the category of food items. Despite splitting this article, it became too long for an email. You can read the whole article here.
Thumbnail credits to macrovector / Freepik.
Completeness of protein sources
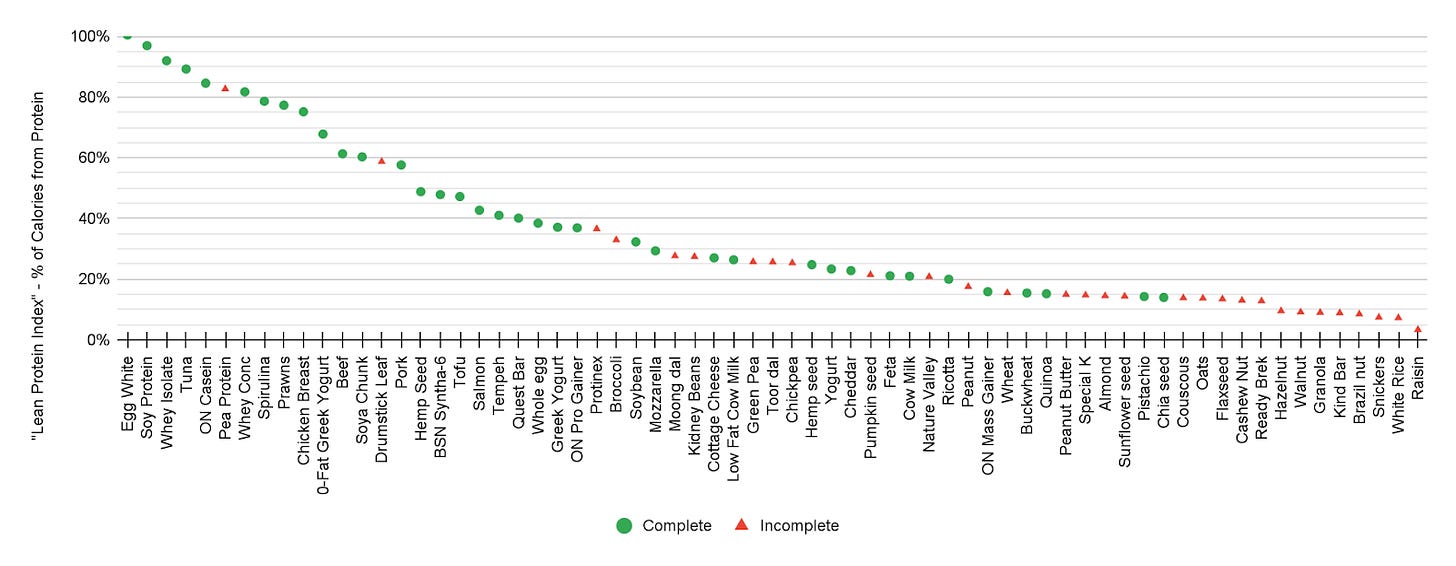
Let us recreate the distribution of food items while categorizing them as complete or incomplete.
Let’s also list out the complete and incomplete food items.
Some food items on the fence of “completeness”:
Pea Protein Supplement - although the protein content is high in the pea protein supplement, Green pea is low in an EAA (essential amino acid) methionine. I wonder whether pea protein supplement manufacturers add any methionine to compensate for this? I’ve marked it incomplete.
Pistachios - although it is a nut and most nuts are deficient in an EAA lysine, 2019-2020 researches from the US claims that the US-grown pistachios are complete sources of protein. I wonder how much of this finding is specific to US-grown pistachio? I’ve marked it complete.
I’ve marked completeness for processed food items like protein supplements or protein bars based on the ingredients. If the major ingredients include milk-based proteins then the food item would be complete but if major ingredirents are nut-based, the item would be incomplete. However, there could be other ingredients that compensate for the EAA profile. This has not been explained on the packaging by the manufacturers, so I have not taken them into consideration.
Ranking based on completeness
If we were to rank food items prioritizing all complete items above incomplete items, we would get the following for distribution of protein (g) and distribution of lean protein index (g/kcal).
Completeness vs Protein Content
A complete protein source might be low in total protein per 100g or might be high in calories from carbohydrates or fat. Whereas an incomplete source of protein might provide sufficient protein and get compensated easily from other protein sources. For example, a blog from Integris Health says these are some combinations of foods to get complete EAA from protein:
Whole-grain pita bread and hummus
Peanut butter on whole-grain toast
Spinach salad with nut and seed toppings
Steel-cut oatmeal with pumpkin seeds or peanut butter
Lentil soup with whole-grain slice of bread
One way to rank could be to deprioritize all incomplete protein sources with the lean protein index less than a threshold. Since most calories from a food item come from carbohydrate, protein, and fat combined, the target could be 33% (one-third). So, we will prioritize only incomplete sources with more than 33% protein and all complete sources. We will rank the remaining incomplete sources below these. This gives us the below ranking, with the top rank on the left and bottom rank on the right.
Processed vs Natural food items
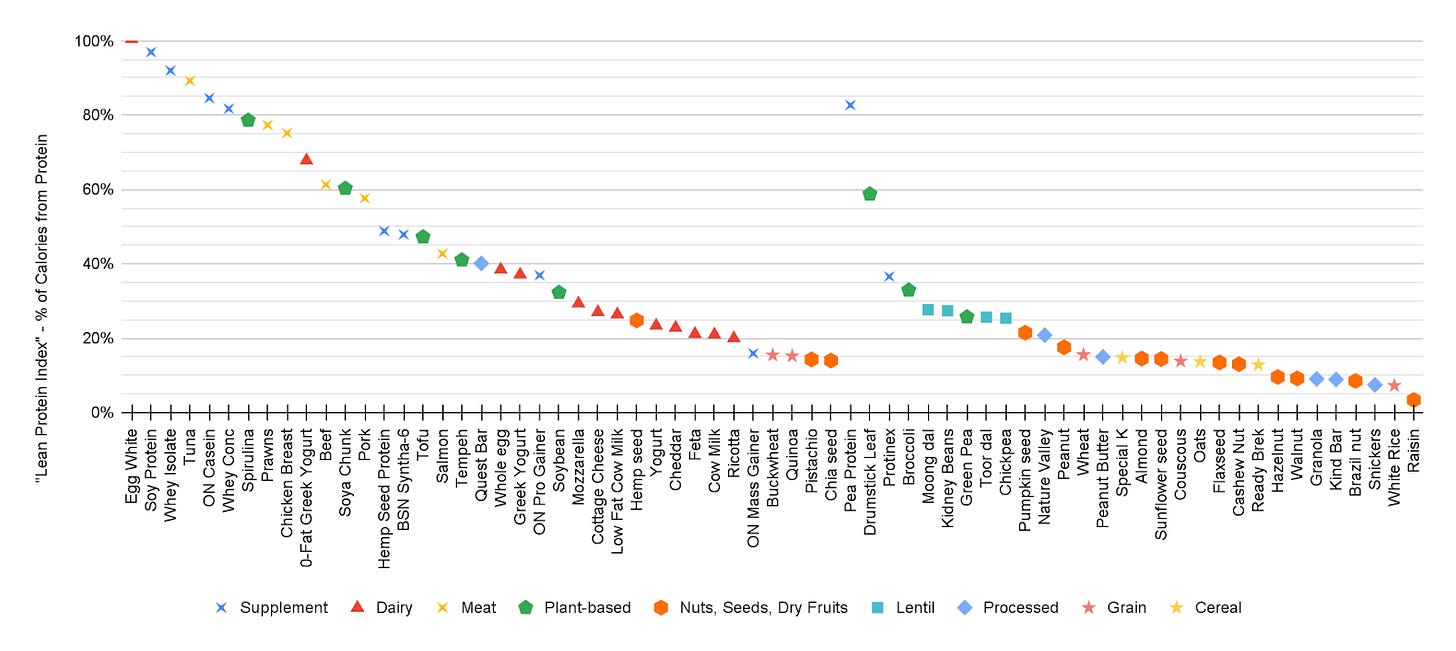
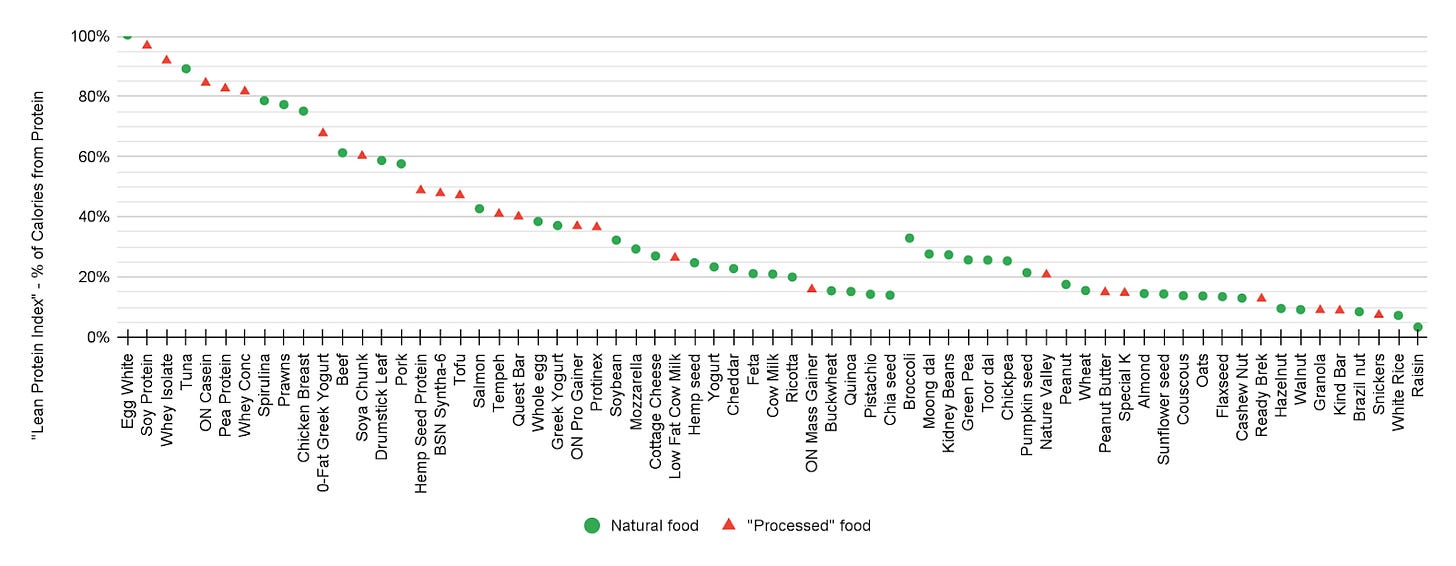
When I showed my analysis and ranking exercise to some dieticians, one feedback I received was there were too many processed food items. Although I included cereals and protein bars to verify how good or bad they are, my hunch was the analysis would show protein supplements in a good light. But what if some folks want to only review the ranking of natural food items? To filter to only natural food items, I’ve classified each item as natural food or not. It sometimes gets tricky. For example, soybean is a natural food item, but are tofu and tempeh natural as well? I have not marked them as natural. I have marked Raisins (Sultanas) as natural because the process can be done by only sun-drying a natural food item, grapes. Let’s see the ranking of food items based on the lean protein index, similar to the graph above, but with the tagging the natural sources of protein.
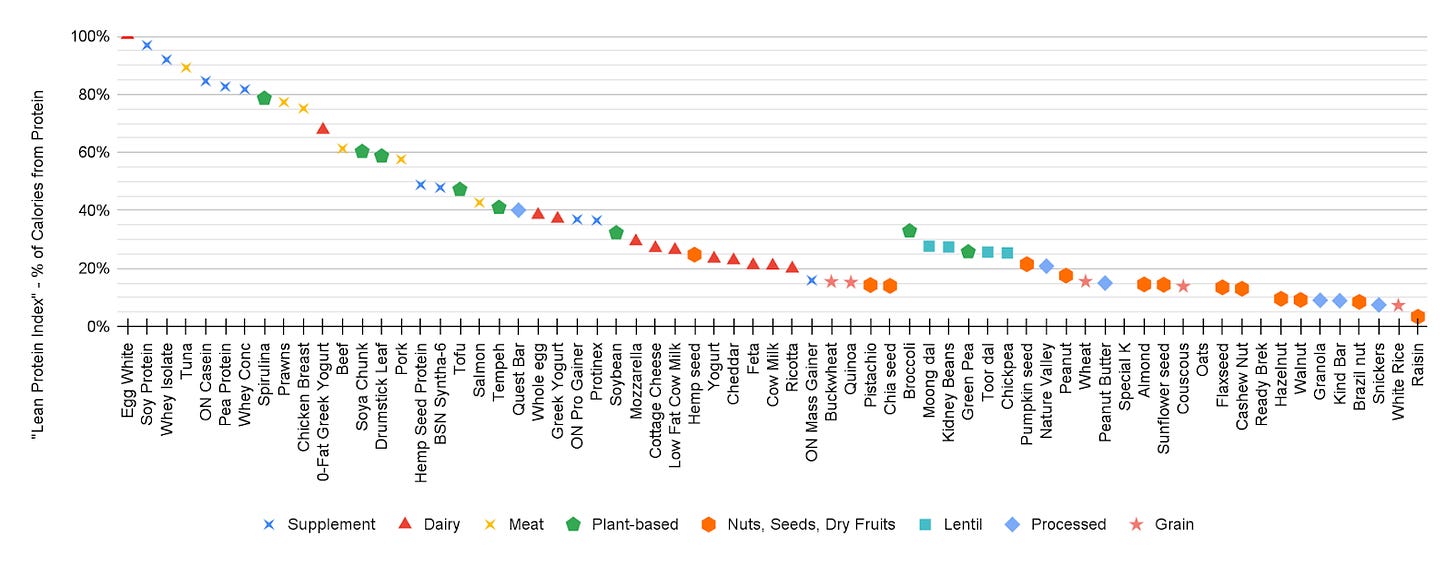
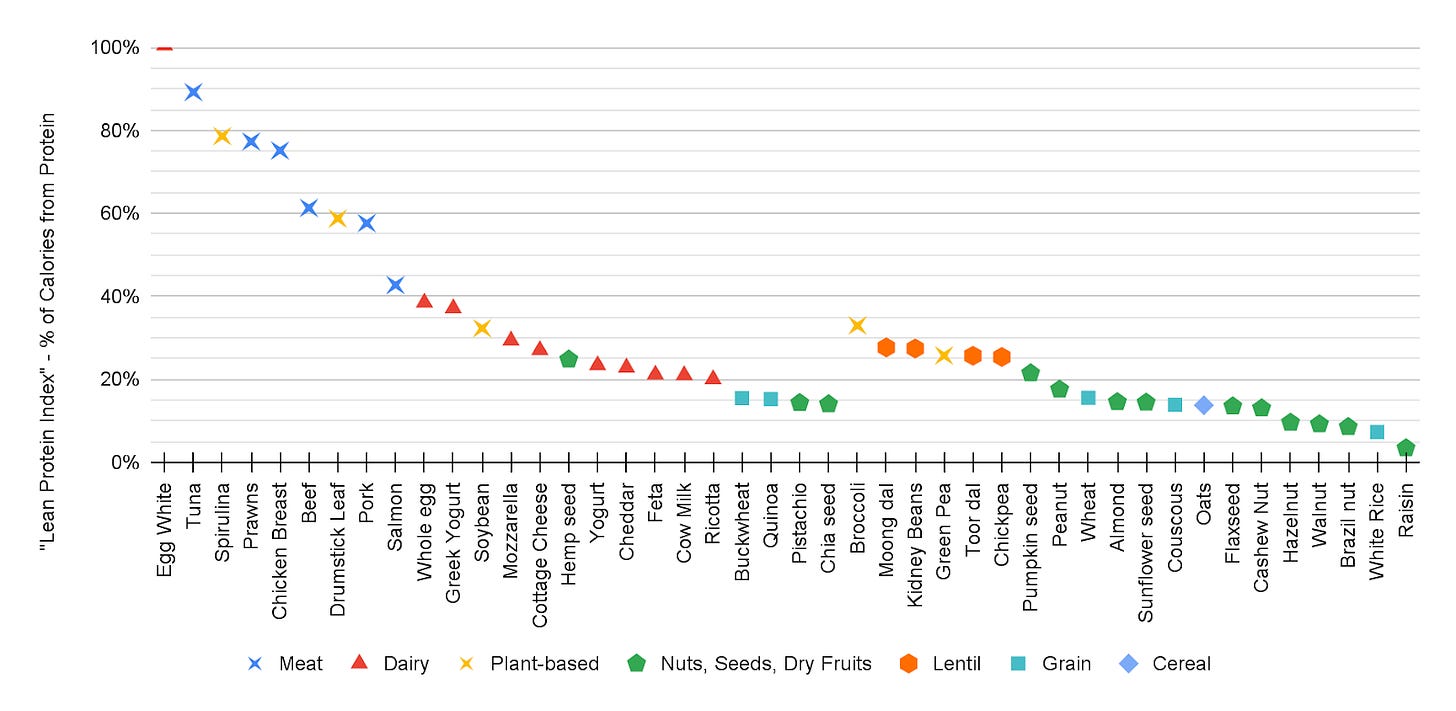
Following this, I’ve filtered down to just natural sources and created the below visual.
Quality of Protein source vs Expense
We have discussed two metrics that determine the ranking of a protein source:
Completeness of the protein source
Lean protein index
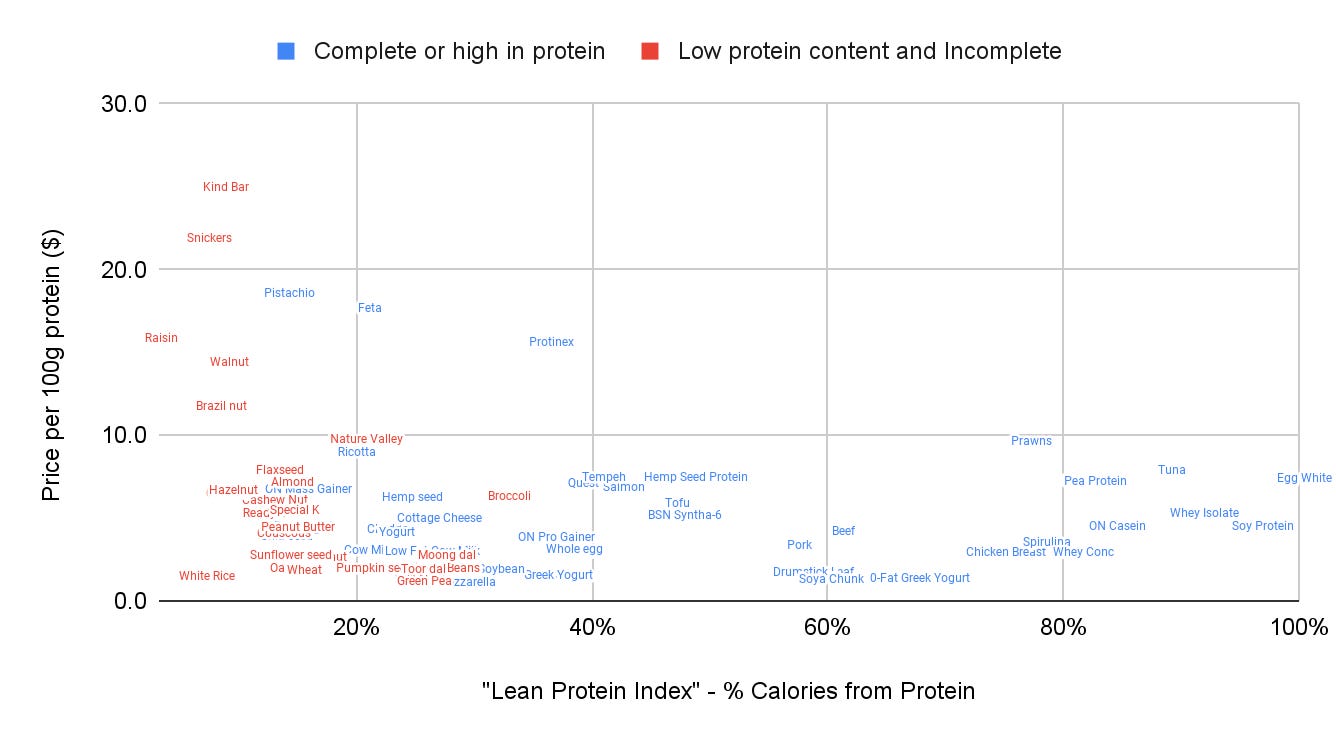
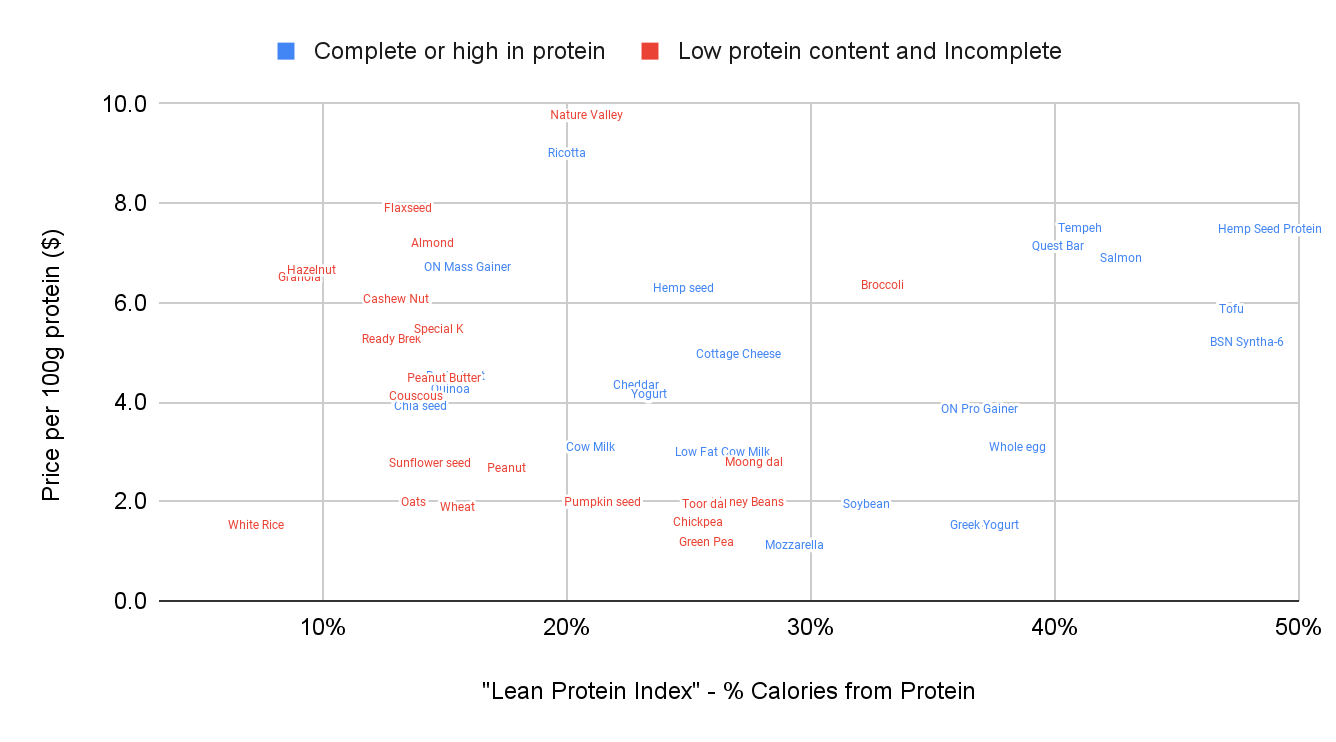
If two protein sources are similar in the above two metrics, the expensive one should be ranked lower. But is it a linear relationship? If two complete protein sources have a lean protein index of 50% and 25% (i.e. 2x) but the expenses are 4x different, e.g. $10 vs $2.50, should we go with the former or the latter? It is not an obvious decision. We can attempt visualizing using a contour graph, where all items of similar lean protein index are on the same contour, but we see how their distribution of expense is.
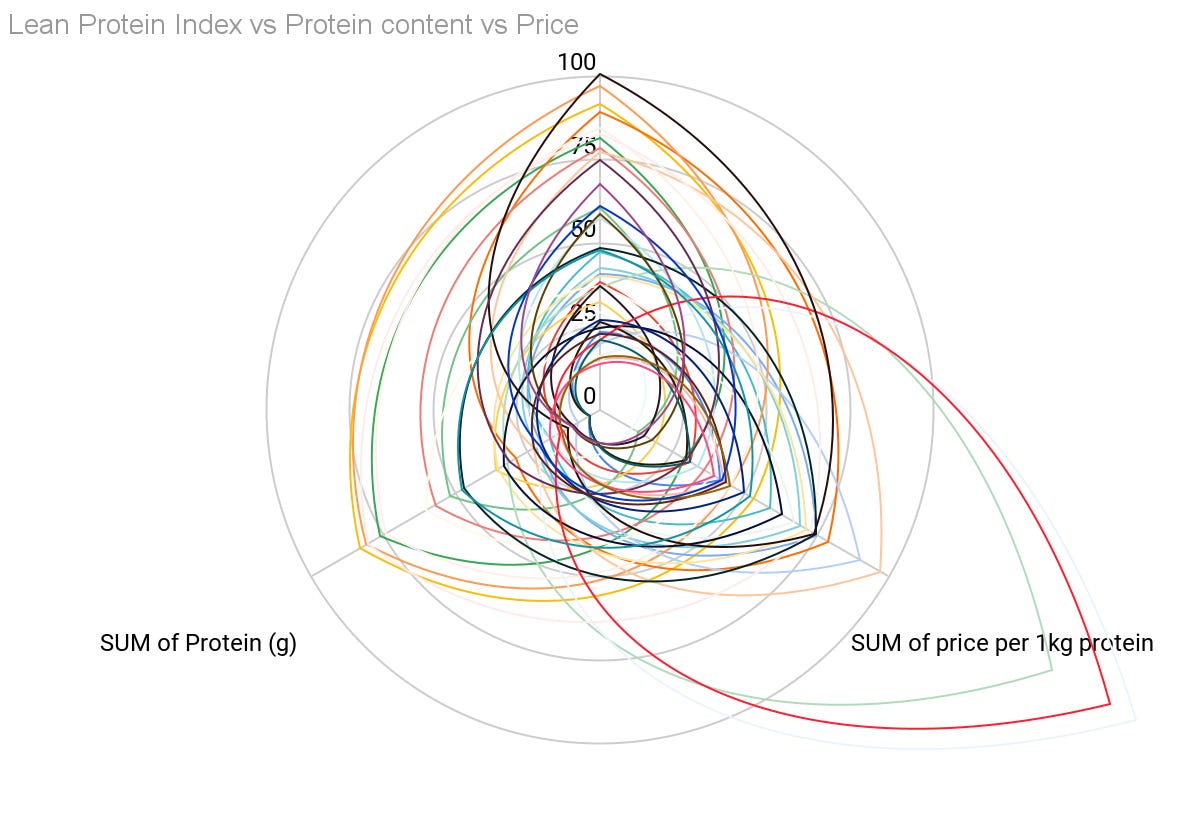
A radar graph wasn’t useful, so we will go back to scatter plots.
This is more understandable. Most of my data on expenses is from online grocery deliveries from Tesco and Amazon. I earlier hid the Moringa drumstick leaf from the scatter plot, since it is 4x expensive than the next highest food item and was reducing visibility resolution for other items. Then I realized Moringa drumstick leaf is not available in Europe, where it is available primarily in powder form. So, I’ve used an Indian website to get the price of it and update the graphs. I also created a zoom-in version of the above to highlight the overlaps below a lean protein index of 50%.
Looking at this, we have a few ways to rank the sources:
Within an expense band, e.g. $2-$4, $4-$6, $6-$8, we consider the price to be approximately equal. These bands could also be defined on a logarithmic scale, so that we can define the bands as a geometric progression e.g. $2-$4, $4-$8, $8-$16. Within each expense band, we rank the food items based on their lean protein index.
Within a band of lean protein index, e.g. 80-90%, 90-100%, we consider the index to be approximately equal. Within each band of indices, we rank the food items based on their expense.
We give a weightage to each expense band and each band of lean protein index. Then we multiply the weights and rank based on that aggregated metric. However, this has the same issue as we discussed before, i.e. what are the proportionality variables or exponents? E.g. If an item is 2x better on the lean protein index but is 4x in expense, is the food item higher ranked or lower?
What is more important? What is intrinsic vs transient? The KPIs we define are
To decide what food items to buy, prepare, and eat
To understand characteristics of the food items
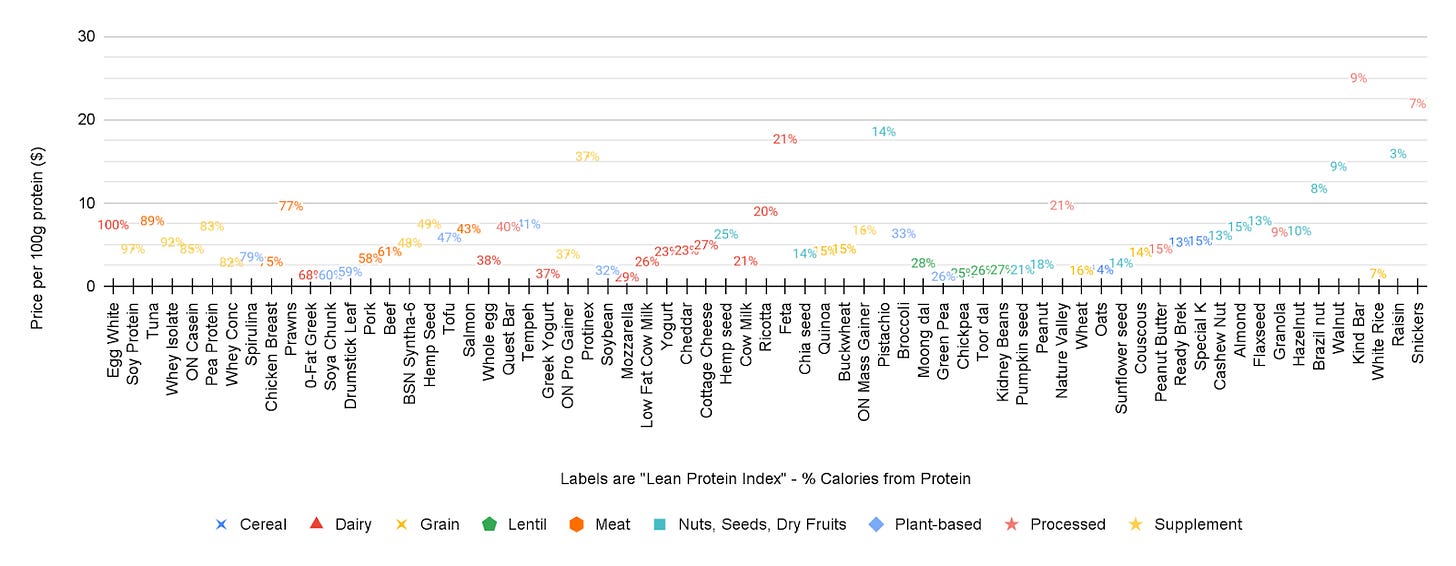
The nutrition value of food items is intrinsic whereas the expense for a food will change over the years, across geographies, and as we purchase in bulk. So, the ranking should primarily be based on the lean protein index. In cases where the index is similar for two food items, they can be ranked based on the price per 100g of protein. Since the index is important, we will consider only a short range of indices to be equivalent. Let’s choose 5%. I’ve built formulae to rank the food items based on their completeness, their lean protein index, and price and visualized the result below. The highest ranking is for Egg White and lowest for Snickers below.
Unfortunately the visual does not explain things apart from the horizontal axis being in the correct ranking order. We can write down the ranking here.
Overall ranking of protein sources
Rankings per category
I’ve split the above ranking per category. It does not explain which category is better than the other, it only explains the ranking of food items within each category.
Gaps in the Analysis
Gaps that could be rectified with more effort:
Incomplete sources of protein might still be of great value for anyone eating a variety of food items. So, one could rank incomplete sources based on which EAAs are missing, how common are those EAAs in most eaten food sources, etc.
We had also defined a goal of “ease”. I could find an easy quantitative way of defining it so I didn’t use that metric. A way to define it would be the time to prepare a food item. E.g. Tuna takes a lot more time than mixing a protein supplement with water.
What’s Next?
I started the previous article mentioning a desire to rank both protein and carbohydrate sources. We will look at the latter in the coming article.
Subscribe to Harmony
Harmony of Technology, Business, and Entrepreneurship. Featured on the front page of Hacker News. Trusted resource for 100s of PMs and entrepreneurs. I am building-in-public.


