Metrics vs Nature: Ranking Proteins - P1
Similar to ranking fruits and vegetables, we will convert a variety of foods to numbers and rank them. Ranking to determine the best sources of protein and carbohydrates. Part 1.
We’d previously ranked fruits and vegetables on a single axis in this and this article. The process helped me learn and illustrate that we can determine a goal, define metrics of success towards it, and quantify varied items to make them comparable. We literally compared apples vs oranges (oranges win!).
As I moved along my fitness journey, recognizing quality carbohydrate and protein sources also became necessary. The challenge in using existing sources of information online is:
They do not contain all the food items of interest, e.g. plant-based sources may not be included
They do not normalize the protein content, e.g. the website might compare “1 fistful” of almonds with 100g of tuna.
They do not contain details on amino acid profiles, i.e. which of the 22 amino acids are present in the food item
They do not contain pricing information
They do not have the tooling to compare food items
I recently ranked food sources for their protein or carbohydrate content and would like to share the process and the learnings here. Like it did for me, I hope going through this exercise helps you understand KPIs, learn data analysis and synthesis, and use it as a cheat sheet for choosing protein and carbohydrate sources if/when you are maintaining a diet. Despite splitting this article into two, it might be too long for an email, so you can read the whole article here.
Thumbnail credits to Food photo created by master1305.
Protein Goals
We will discuss goals first, then metrics for the goals, and then quantify the food sources on these metrics.
Let’s look at the goals for protein consumption:
Consume several grams of protein
Consume all essential amino acids (“complete protein” sources)
Let’s consider some anti-goals:
Consuming a lot of other macronutrients (fat, carbohydrates) along with the protein
Consuming calories over one’s calorie target for the day
Tertiary objectives:
Spend less money for reaching the goals and against the anti-goals
Spend less time for the same
Protein Metrics
How would we measure these goals? We can look at different food items of interest and measure their:
Protein content
Calorie content
Expense
“Completeness” of protein source
I found a similar expense metric used also in an article from the Harvard School of Public Health. We need to delve more into “completeness” and identify possible metrics for it.
Complete Protein
A protein is considered “complete” when it has the nine essential amino acids in sufficient amounts, as per a blog on Integris Health. Medline Plus (.gov) mentions that the 9 essential amino acids are:
histidine,
isoleucine,
leucine,
lysine,
methionine,
phenylalanine,
threonine,
tryptophan, and
valine.
As per a blog from Cleveland Clinic, as long as you are eating a mix of legumes, lentils, nuts, seeds, and whole grains on a daily basis, you do not need to 1) eat only complete sources of proteins 2) mix and match protein sources to make them collectively complete. I’ve reviewed data for each protein source as well as looked up amino acid profiles to mark each protein source as complete or incomplete.
Should we give higher weightage to foods that contain the 9 essential amino acids? Or rank foods based on how many of the essential amino acids they have?
Which food items to consider
I considered food items in these categories:
Cereal
Grain
Nuts, Seeds, Dry Fruits
Lentil
Processed
Plant-based
Meat
Dairy
Supplement
Across these categories, I considered about 60 food items:
In the visuals below, I have used a shorter version of names for some items instead of the names you see above.
Ranking based on the Amount of protein
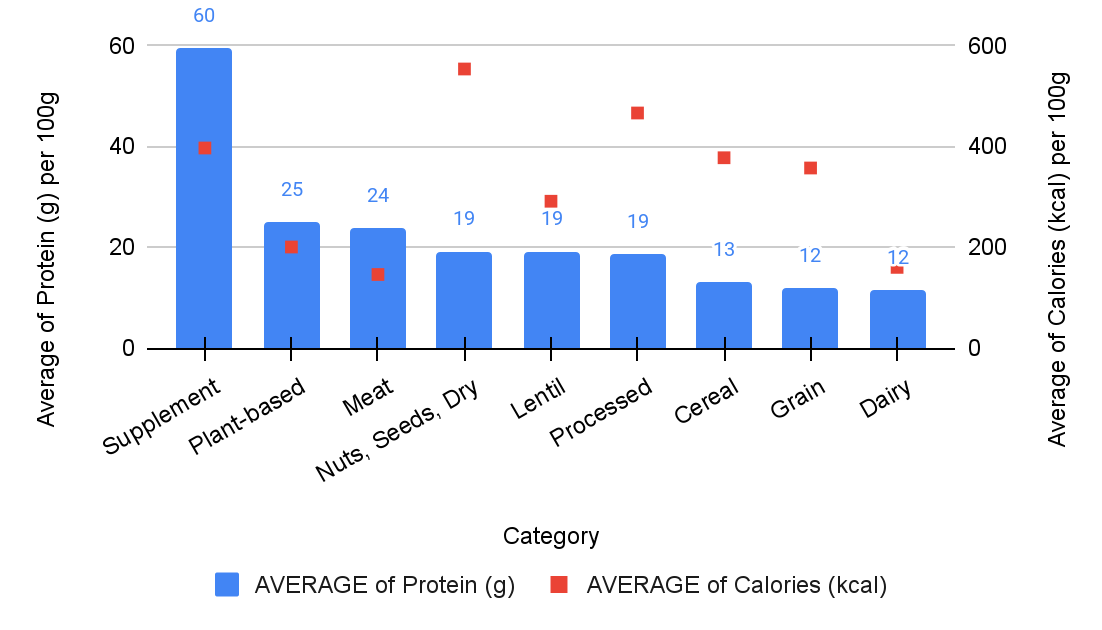
As a first approach, let’s rank the foods based on the amount of protein in 100g of the food.
It seems some food categories of foods like grains are very low on protein. Grains are considered a carbohydrate source usually so that seems ok. Dairy is considered a good source of protein but is the lowest, which is surprising. The protein content in dairy is probably low since milk and milk products have high water content. Let’s look at the distribution per food item grouped by the categories:
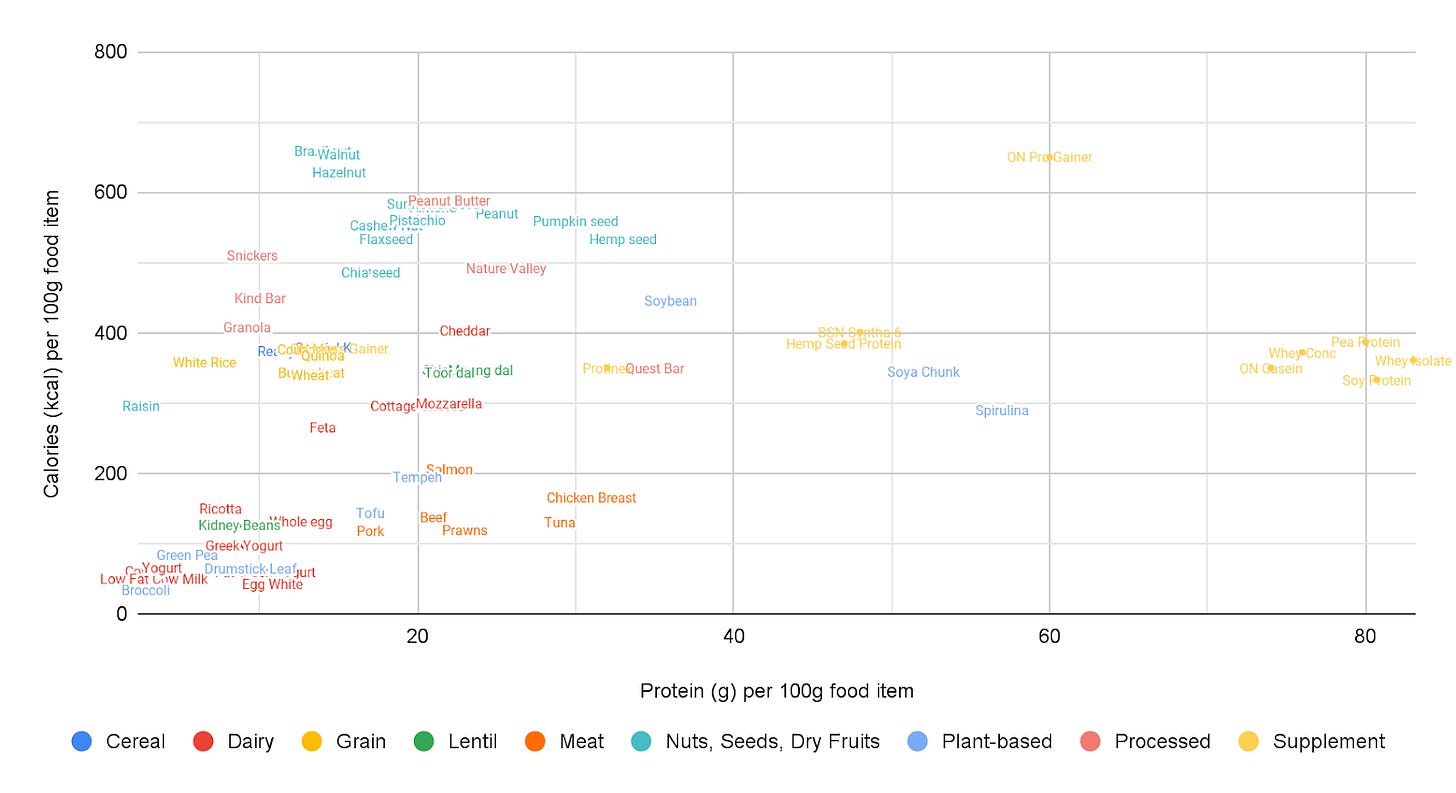
It’s not a surprise that protein supplements are concentrated sources of protein and they dominate the charts. Grains are usually considered a carbohydrate source so being at the bottom of these food items is understandable. Within milk products, the liquids seem to be lower than the solids. We have looked at the distribution of protein grams above, so now let’s look at the calorie distribution.
Showing all food items in a 2D-axis:
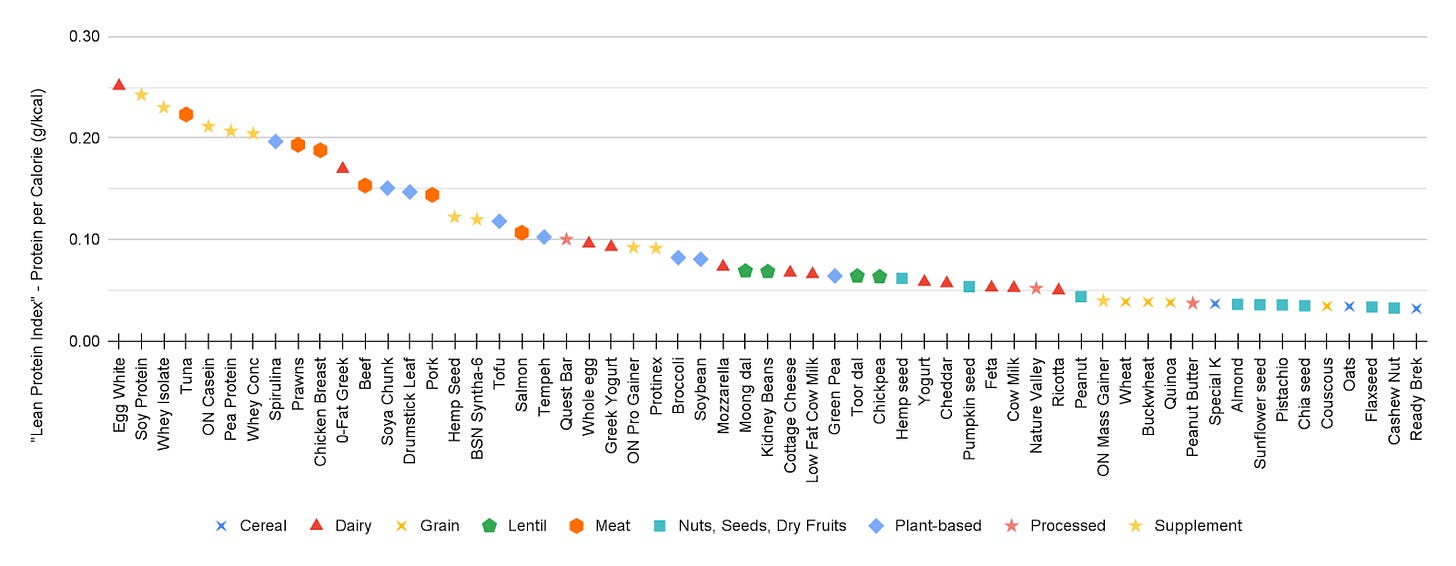
Ranking based on a lean protein index
Let us rank based on a “lean protein index”.
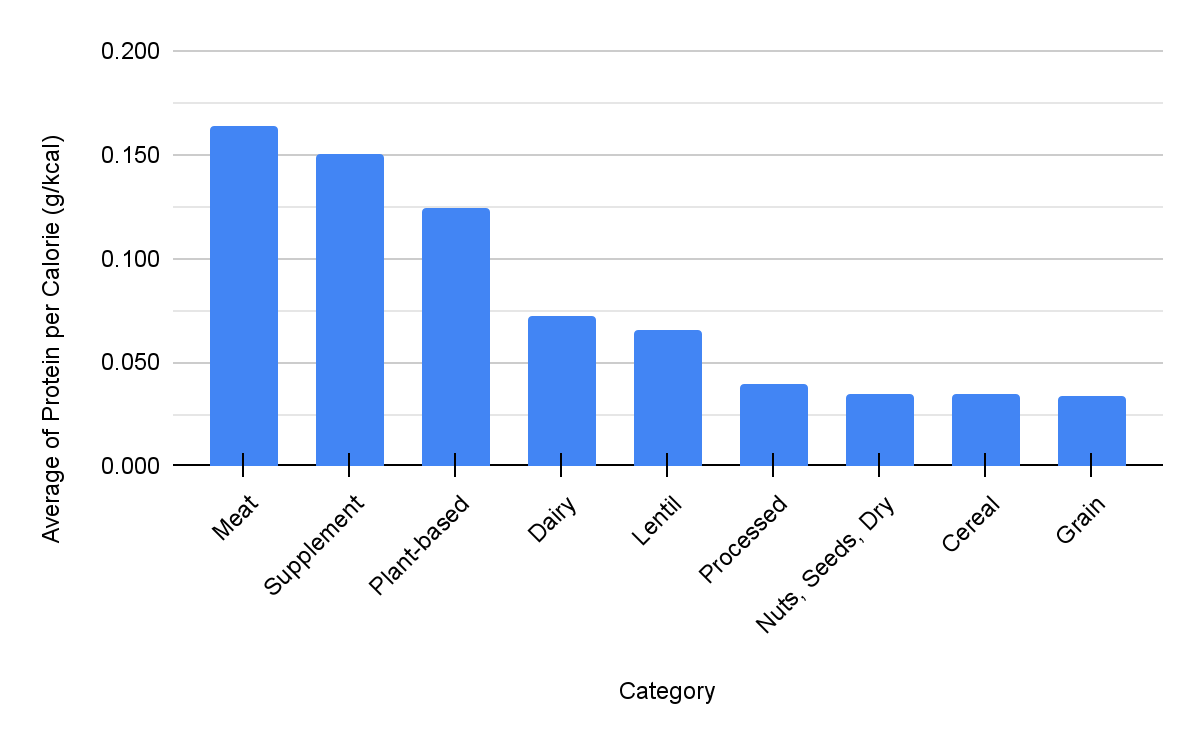
Lean protein index ∝ (Protein grams)/(Calories kcal)
The distribution of the lean protein index across food items has a lot of overlaps across the categories.
The benefit of the above chart is it shows us the best few sources across categories, which are:
Egg white
ON Soy Protein Supplement
ON Whey Isolate Supplement
Tuna
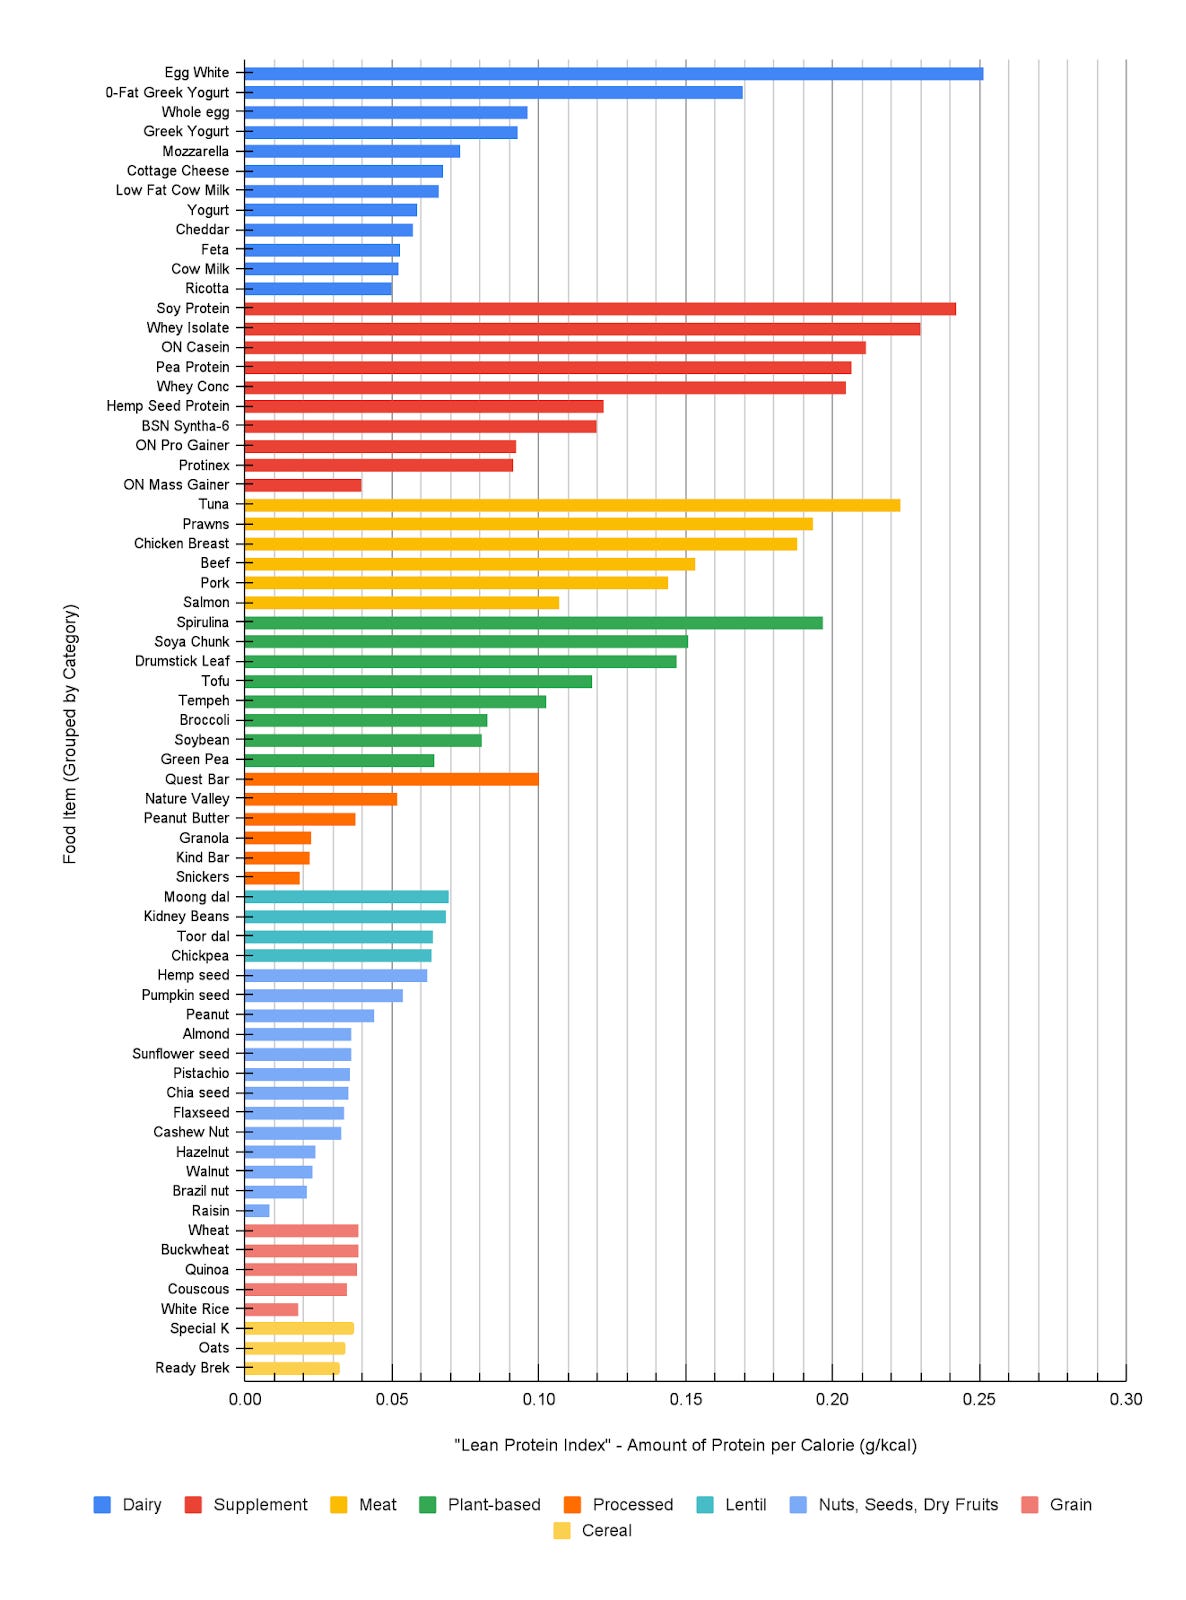
But it is hard to compare food items within a category from the above visual. Let’s group the above items per category.
Take two on lean protein index
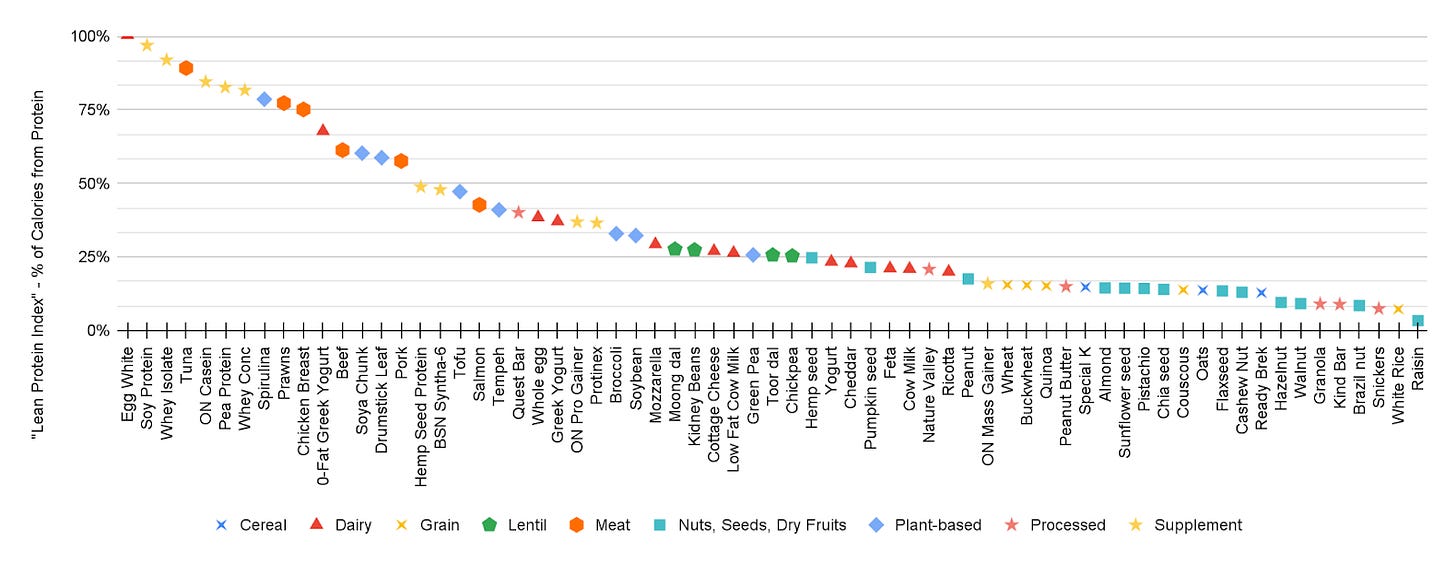
Instead of looking at protein grams, we could look at protein calories, this way we can set thresholds for the % of calories of a food item that come from protein vs other macronutrients.
Lean protein index =(Calories kcal from Protein in 100g of food item)/(Calories kcal in 100g of food item)
The numeric value of this would differ from the previous lean protein index we used, but the sequencing will remain the same, so let us relook at a select few graphs. With the change in the definition of the index, we are able to change it from proportionality to an equation.
On ranking food items as per the lean protein index, we see that many dairy products shoot up in the charts. We also see that protein supplements remain at the top.
Further Questions to resolve
Due to the size of the article for emailing purposes, I’ve split this into a follow-up article. Let’s think of these food items using the remaining goals and anti-goals. Is a protein supplement a complete protein source? Is the expense of a protein supplement similar to dairy products? Are there products that show up high in the lean protein index, such as egg white or tuna, but are not a complete source of protein? How should we rank a complete source low in the lean protein index vs an incomplete source high in the lean protein index? What is the distribution of protein and lean protein index within just the complete sources of protein? We considered several processed food items, what if your preference is for natural food items? How is the distribution within just natural food items?


